Air Quality is Improving
In recent decades, average concentrations of air pollutants in the ambient air have steadily declined across the Commonwealth. These maps were created by scientists at NASA's Goddard Space Flight Center using data from the NASA Aura satellite. The maps show a steep decline in tropospheric nitrogen dioxide (NO2) pollution over Kentucky from 2005 - 2018. In these images, purple and orange areas denote higher concentrations of NO2, generally concentrated around urban areas, while blue and yellow areas denote areas with lower concentrations. The Division for Air Quality's 2025 Annual Report contains additional data and information about Kentucky air quality trends.
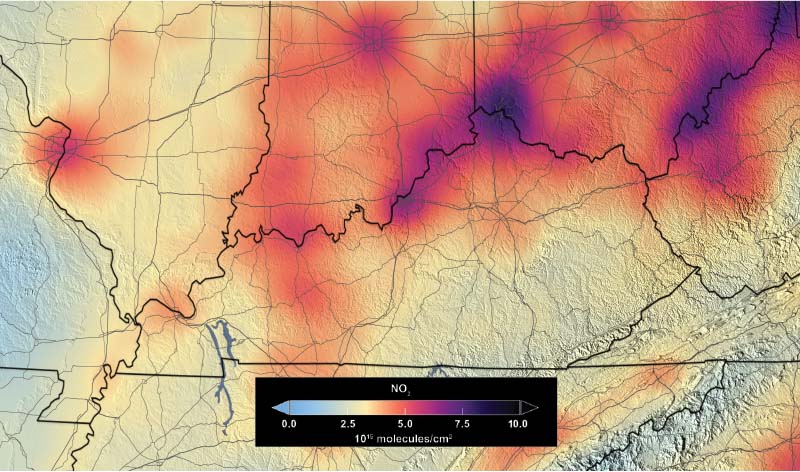
Kentucky Nitrogen Dioxide Concentrations, 2005
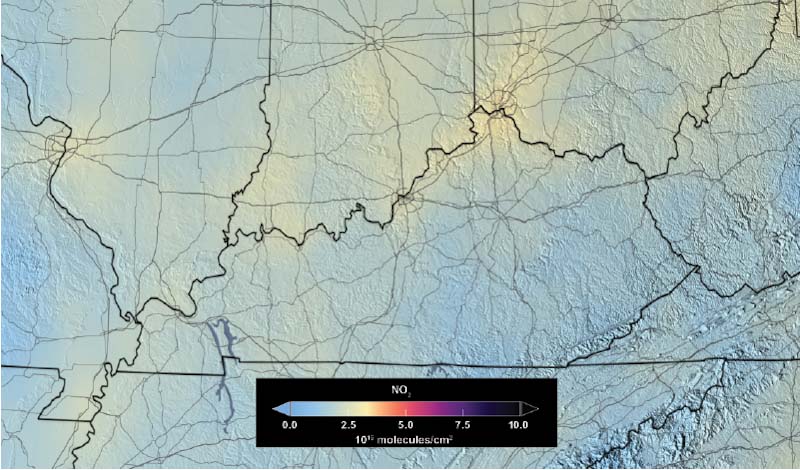
Kentucky Nitrogen Dioxide Concentrations, 2018
Emissions are Decreasing
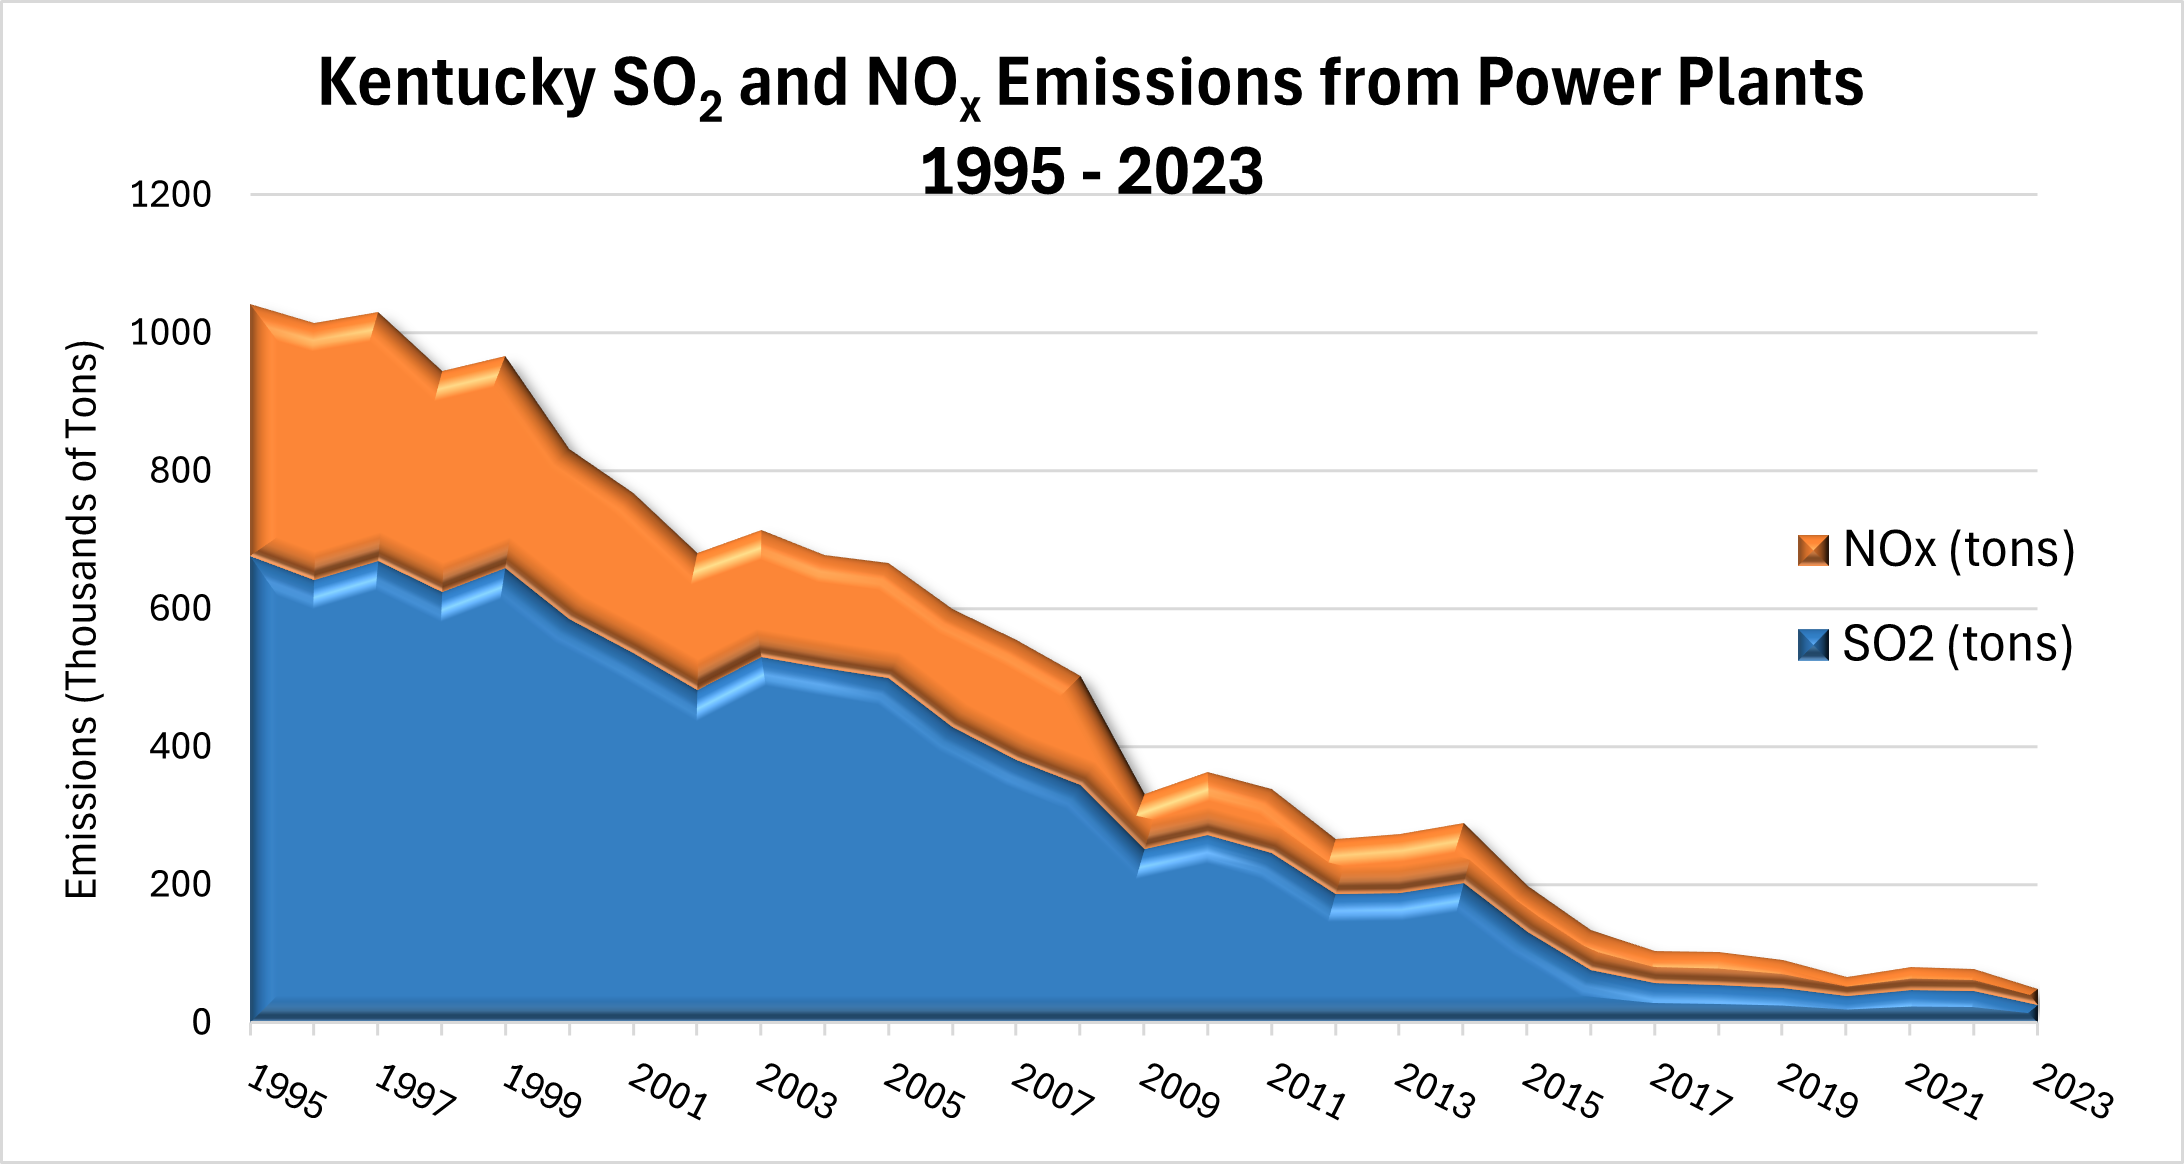
Power plant emissions of nitrogen oxides and sulfur dioxide have dramatically declined over the past decades. These improvements are due to a number of factors including investment in state-of-the-art pollution controls, efficiency improvements, and retirement of older facilities. In the graph below, Kentucky power plant emissions from 2000 - 2021 show steep declines in nitrogen dioxide and sulfur dioxide.
Air Monitoring Data Tells the Story
Kentucky's air monitoring network gathers and analyzes thousands of air samples every day. The charts below show statewide averages for the major pollutants measured. Even as Kentucky's population and economy have grown, the downward trend of each pollutant is evident.
Ozone
Ozone is a colorless gas that is not emitted directly into the atmosphere from sources but forms in the atmosphere from a photochemical reaction between volatile organic compounds (VOCs) and nitrogen oxides in the presence of sunlight. Because meteorological conditions play an important part in the formation of ozone, the Division for Air Quality only monitors for this pollutant between March 1 and Oct. 31 each year. The current National Ambient Air Quality Standard (NAAQS) for ozone is .070 parts per million (ppm).
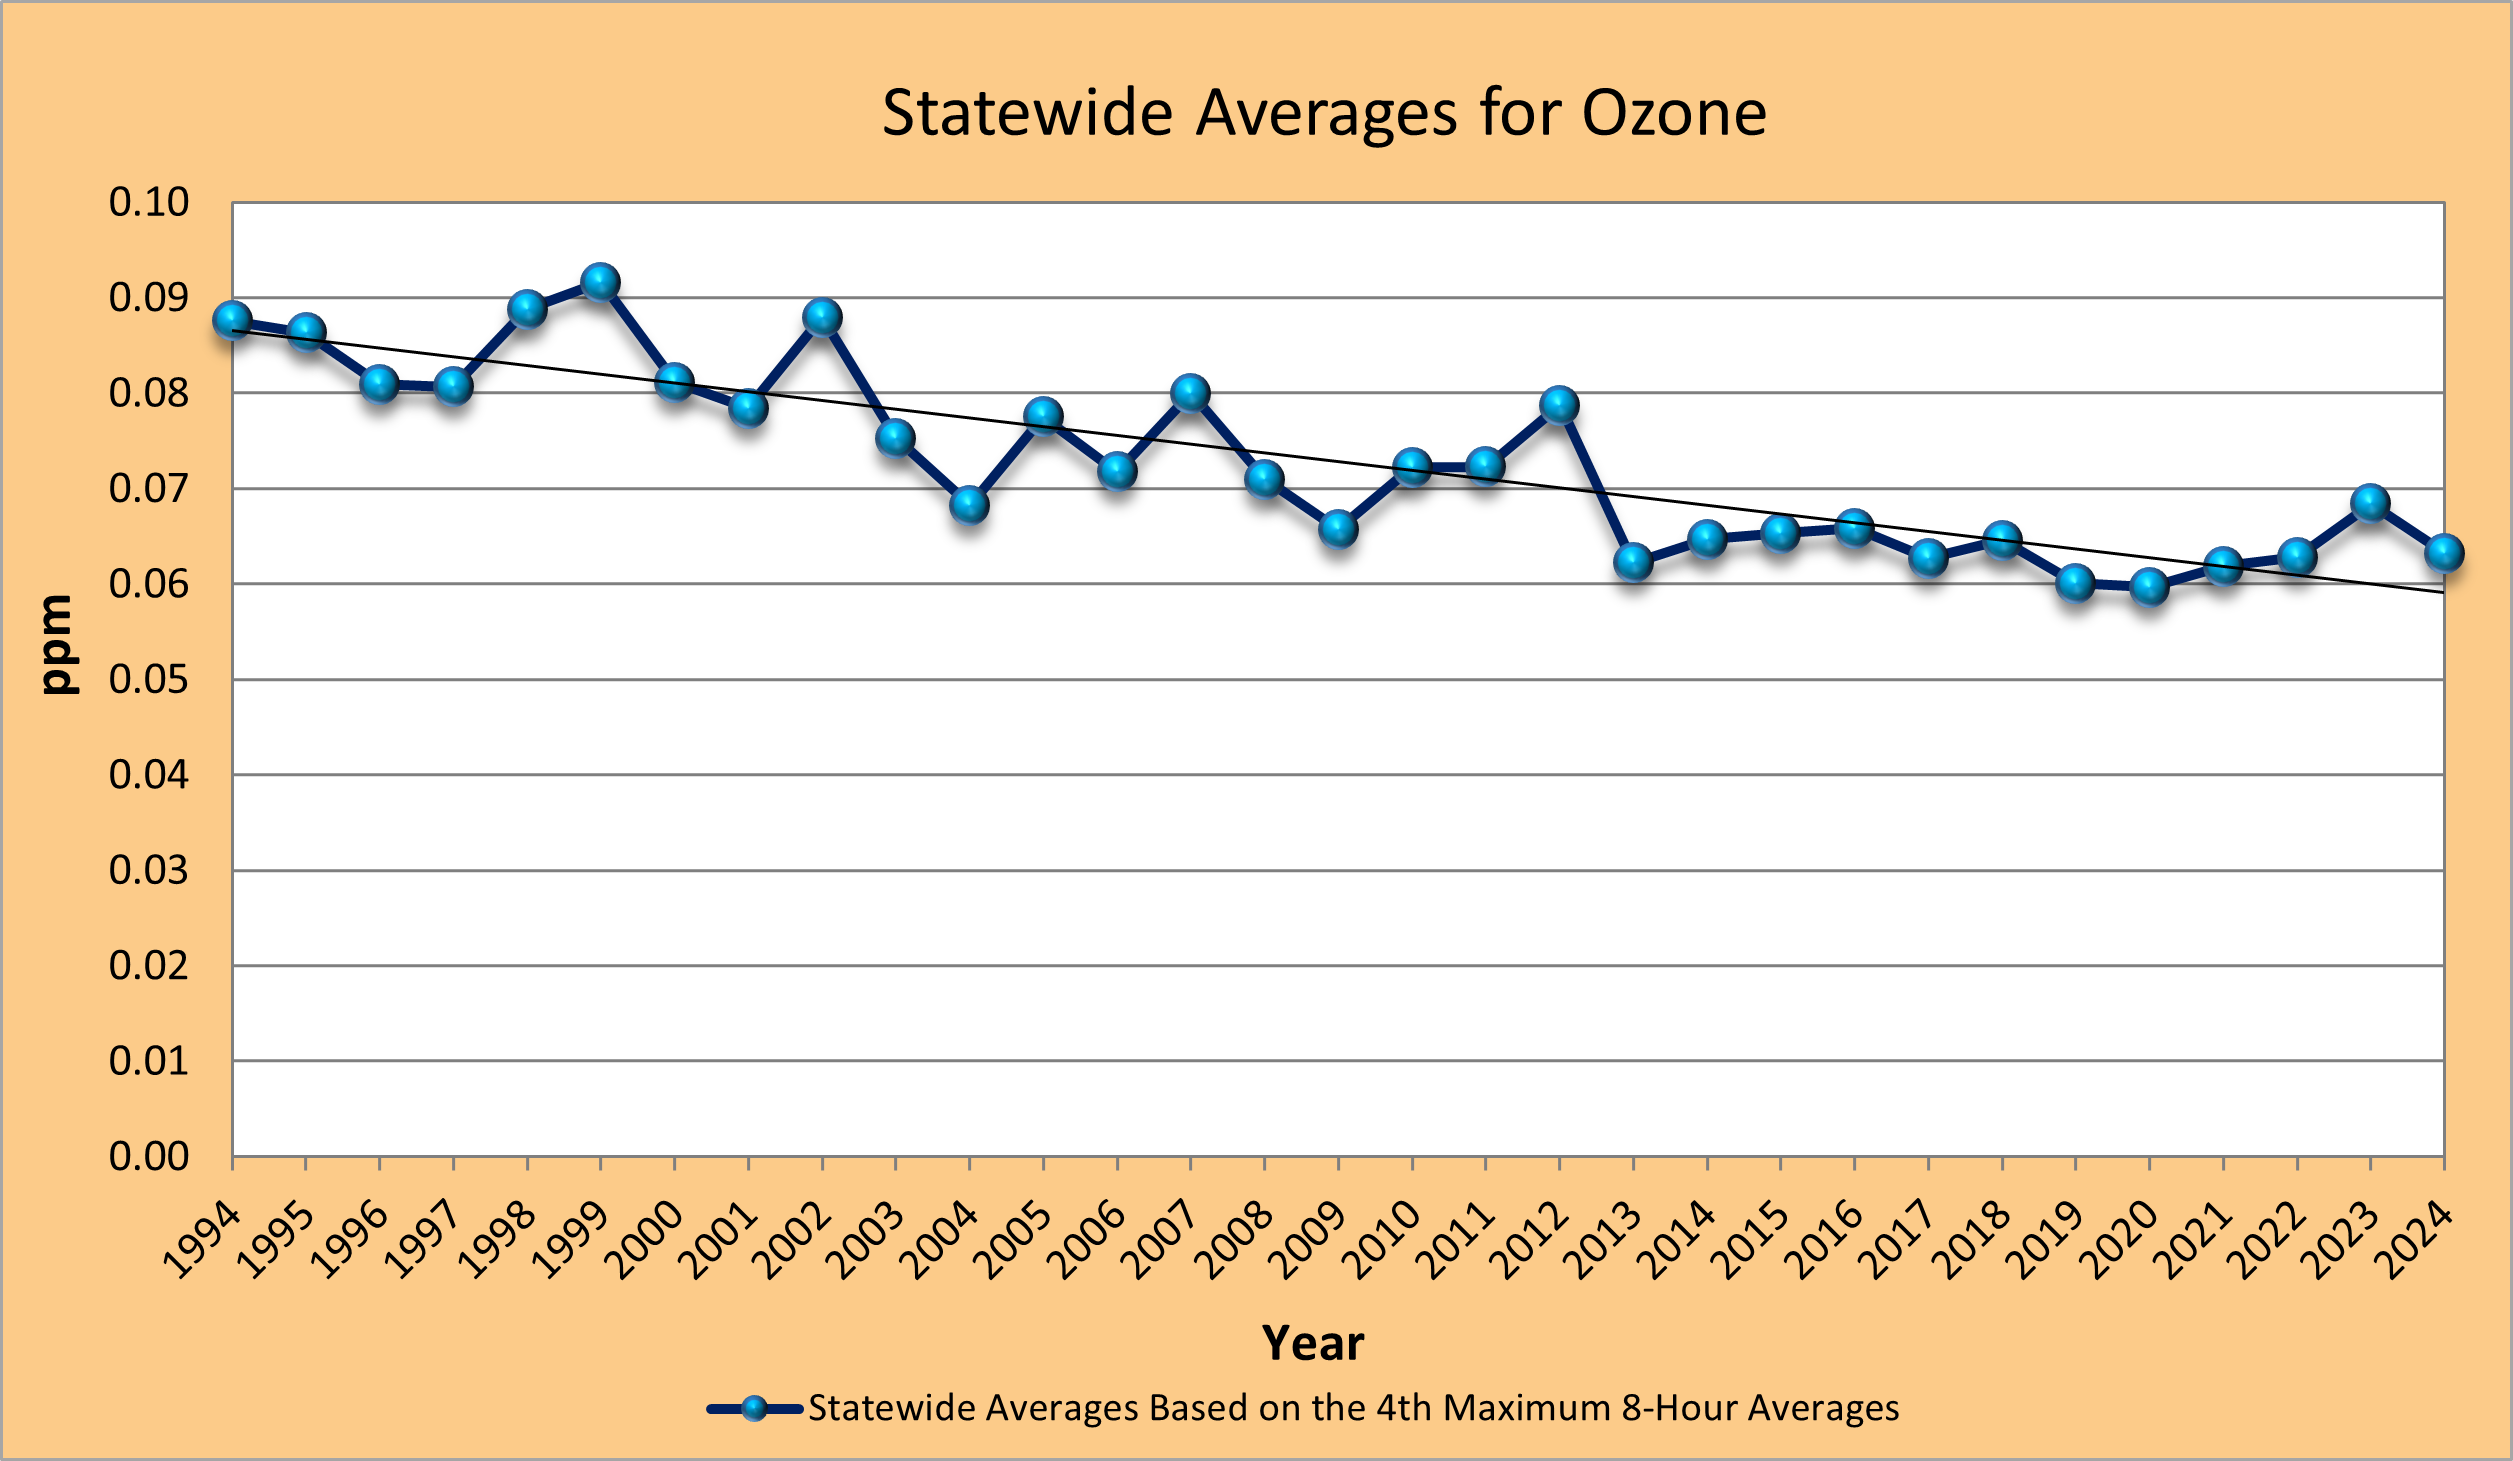
Statewide averages of ozone monitoring data show a downward trend over the past two decades.
Particulate Matter
Particulate matter is a broad classification of pollutants that consists of very fine solid particles, liquid droplets, or aerosols. Fine particulate matter (PM2.5) is composed of particles 2.5 microns or smaller in diameter. The current 24-hour NAAQS for PM2.5 is 35 micrograms per cubic meter, and the current annual NAAQS is 9 micrograms per cubic meter.

Statewide averages of fine particulate matter (PM2.5) monitoring data show a downward trend from 2001 - 2024.
Sulfur Dioxide
Sulfur dioxide is a colorless gas that has a pungent odor at concentrations exceeding 0.5 parts-per-million. Sulfur dioxide is produced by the combustion of sulfur-containing fuels, ore smelting, petroleum processing and the manufacture of sulfuric acid. Coal-fired power plants are typically the largest sources of sulfur dioxide. The current 1-hour NAAQS for sulfur dioxide is 75 parts per billion (ppb).
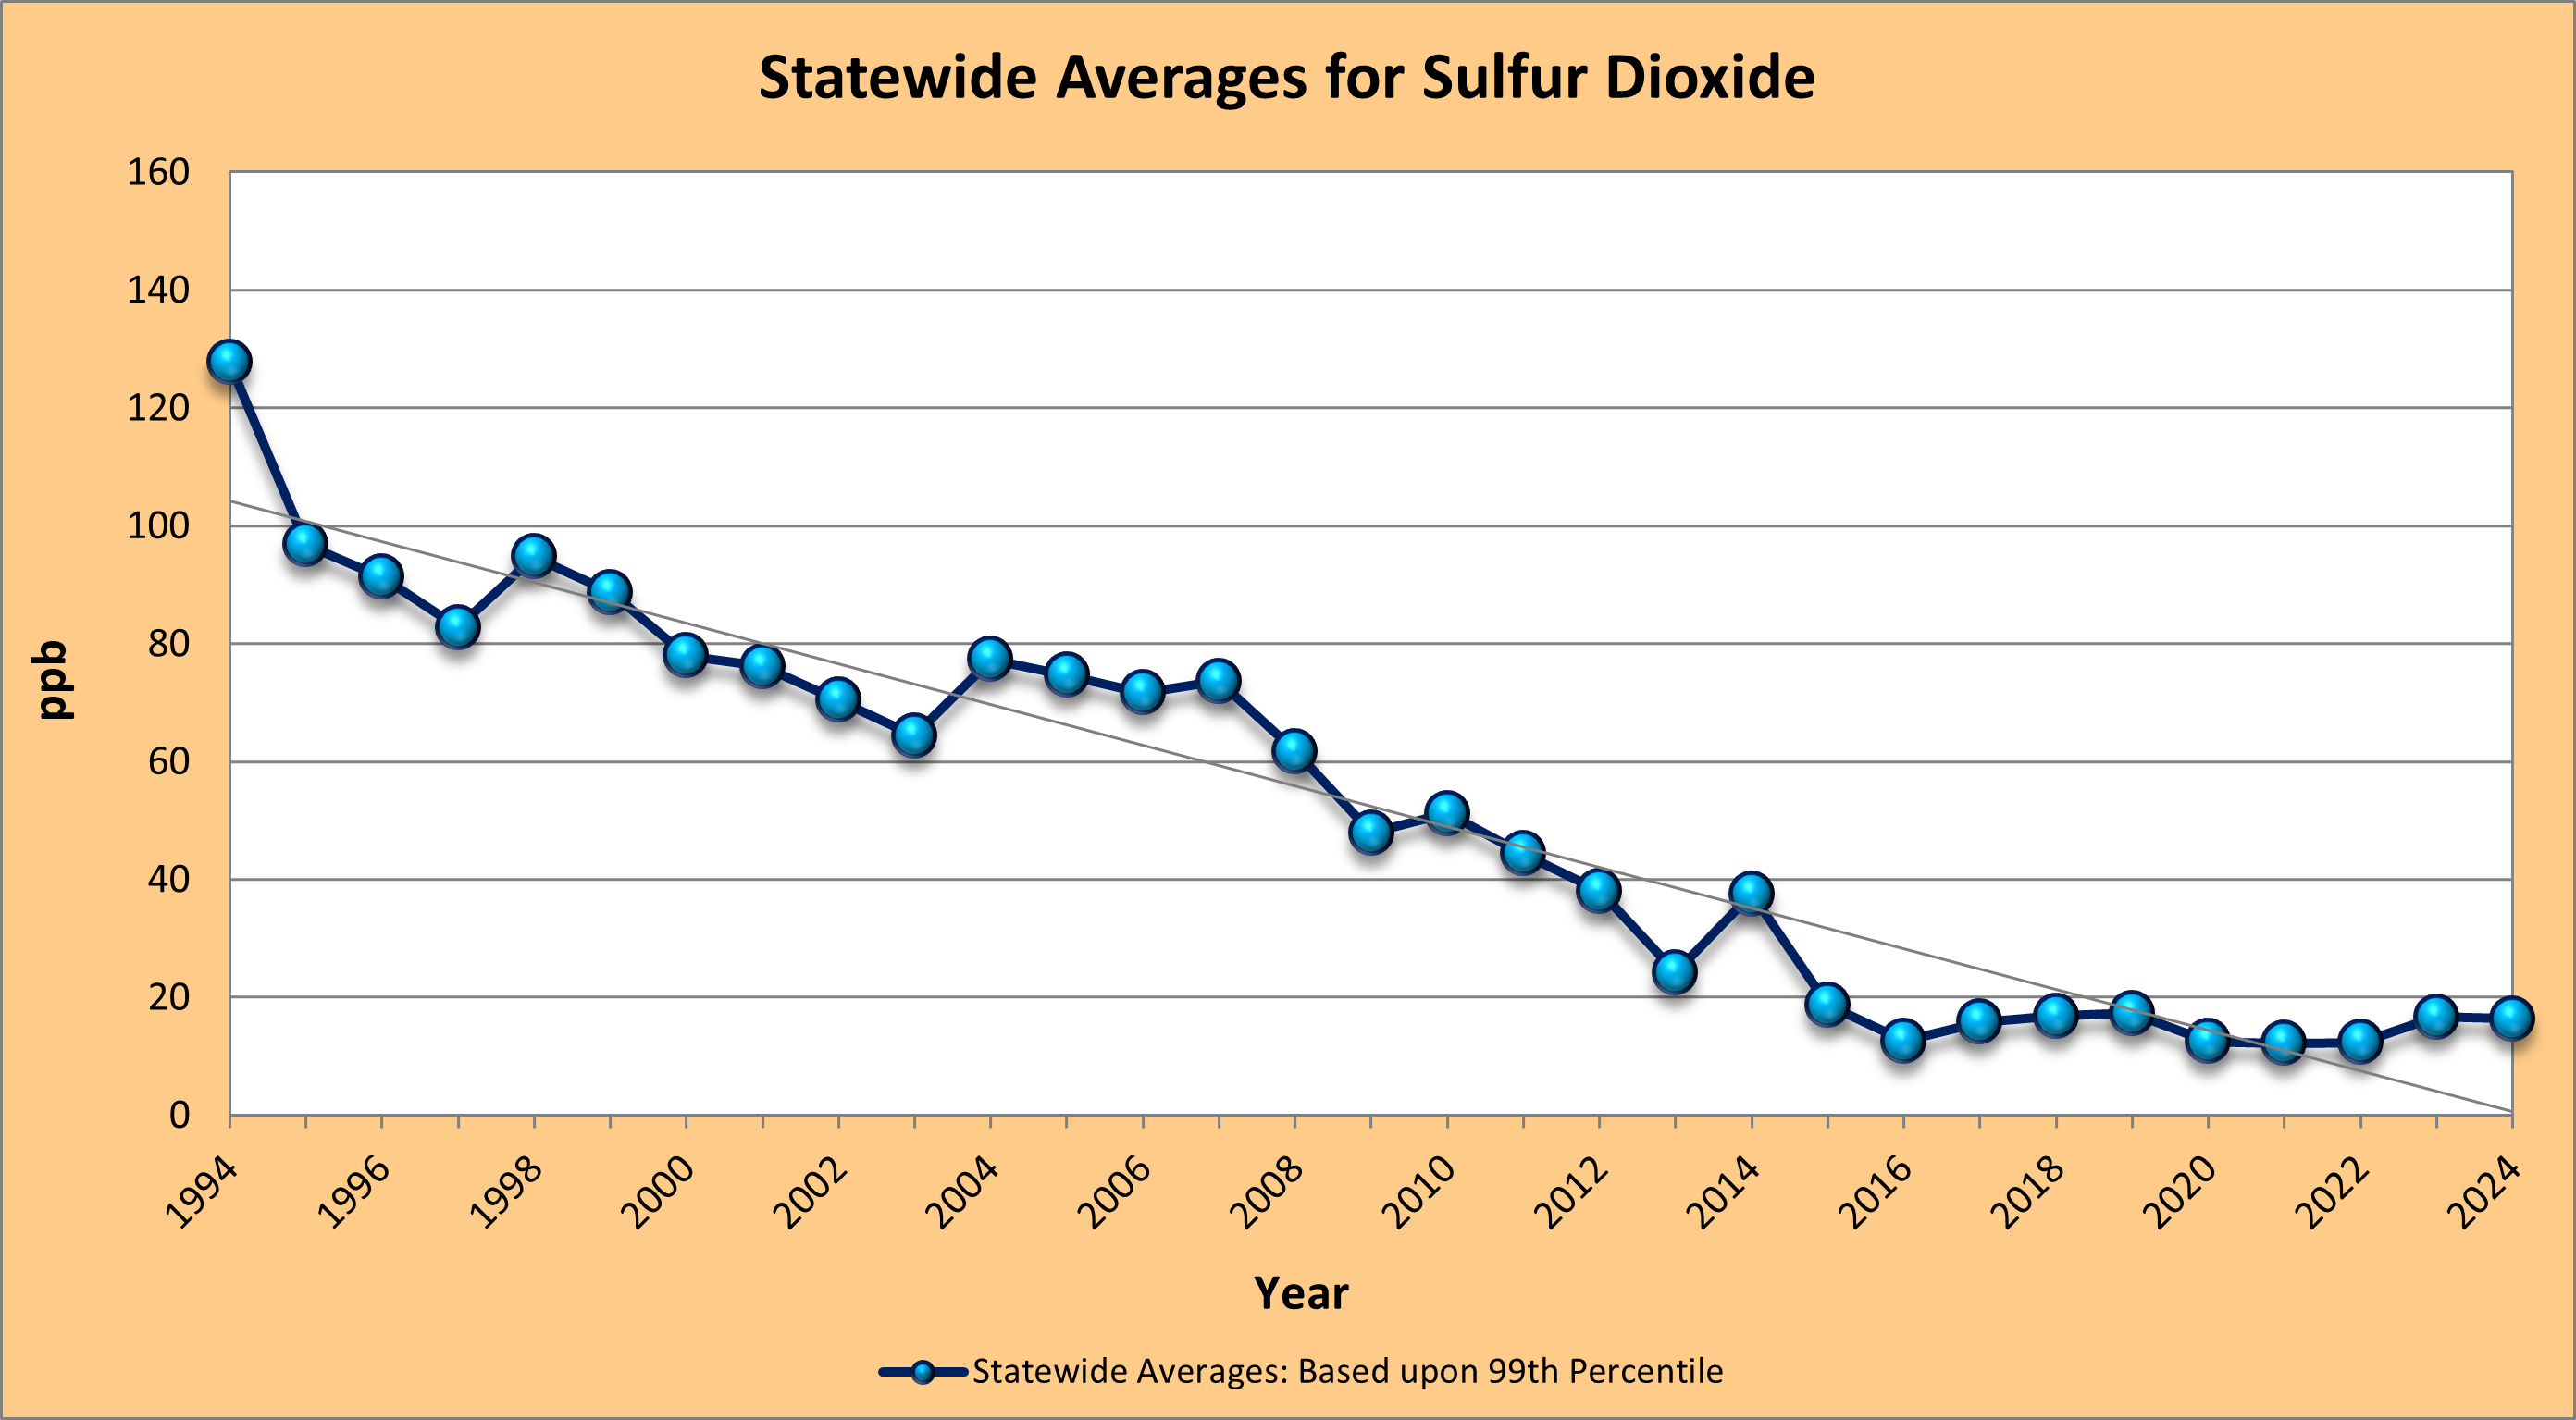
Statewide averages of sulfur dioxide (SO2) air monitoring data have dropped dramatically in the past 20 years.
Nitrogen Dioxide
Nitrogen dioxide is a reddish-brown gas that is produced during the high temperature combustion of fossil fuels. The primary sources of nitrogen dioxide are power plants, motor vehicles, incinerators, industrial boilers and some chemical processes. The current 1-hour NAAQS for nitrogen dioxide is 100 ppb and the current annual NAAQS is 53 ppb.
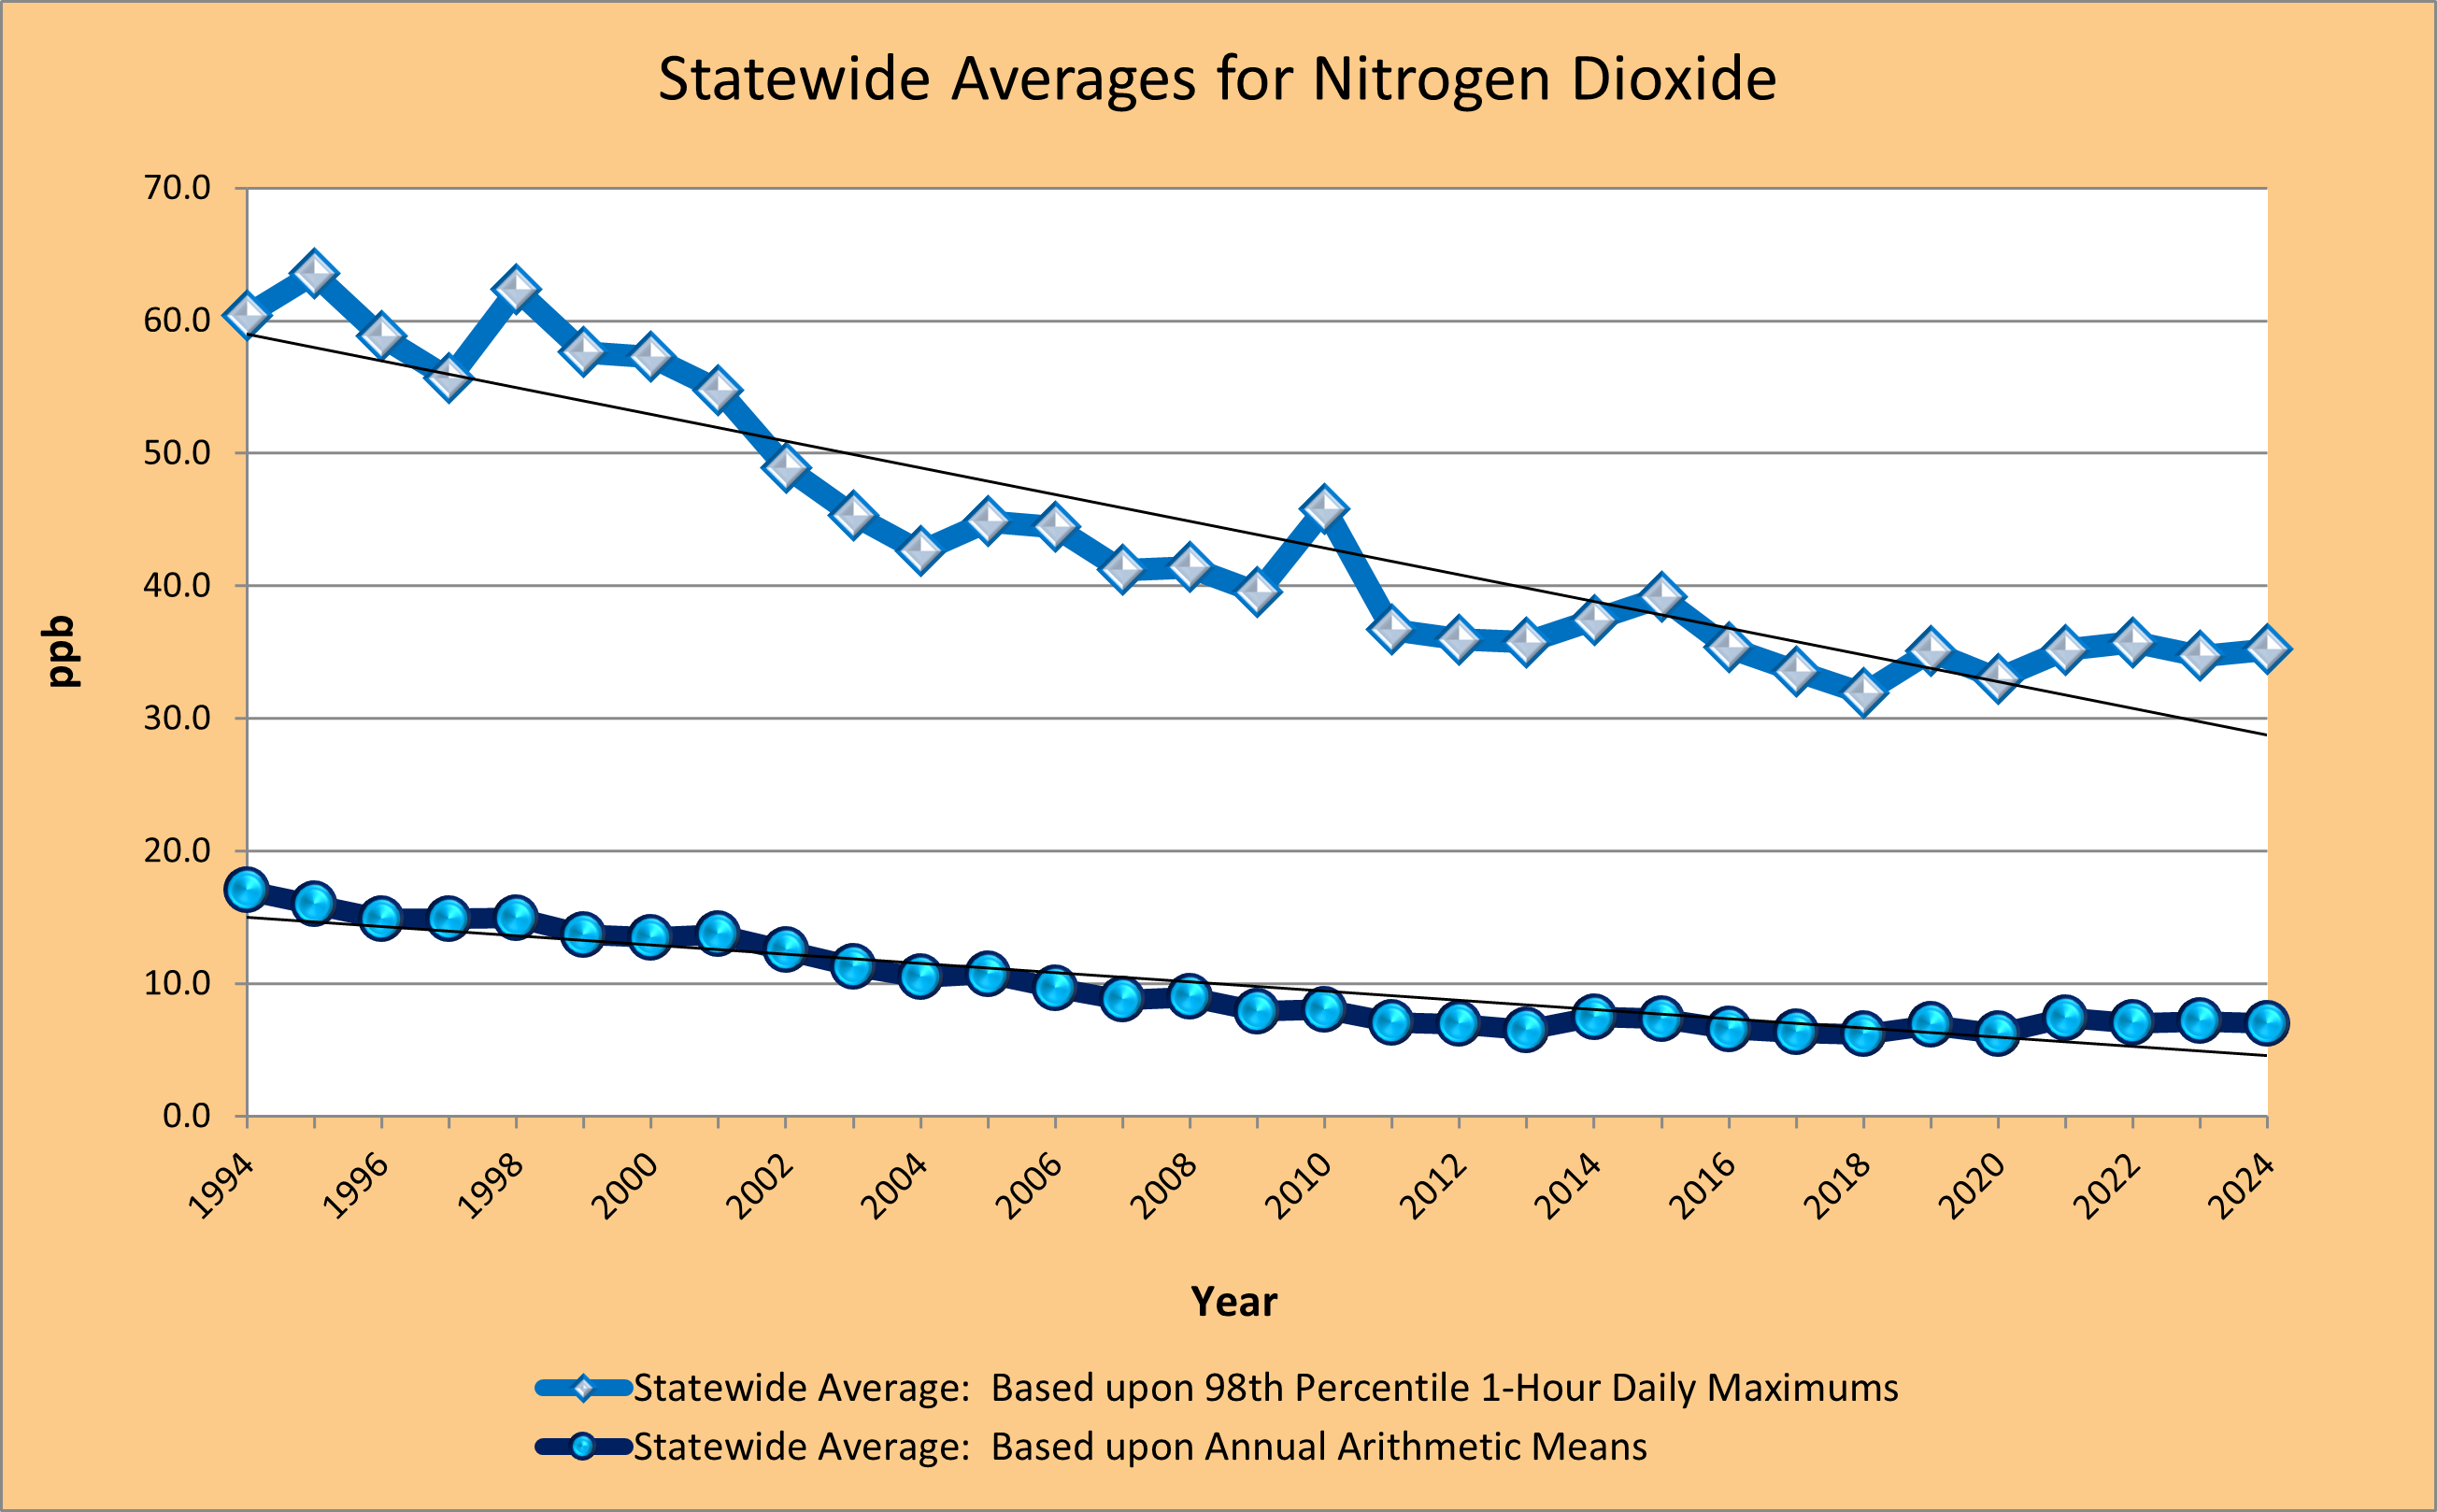
Statewide averages of nitrogen dioxide (NO2) air monitoring data show a steady decline over the past 20 years.
Carbon Monoxide
Carbon monoxide is an odorless, colorless, poisonous gas that is produced by the incomplete combustion of carbon-containing fuels. The primary source of carbon monoxide is the exhaust from motor vehicles. Other sources include industrial processes and coal, kerosene, and wood-burning stoves in homes. The current 1-hour NAAQS for carbon monoxide is 35 ppm and the current 8-hour NAAQS is 9 ppm.
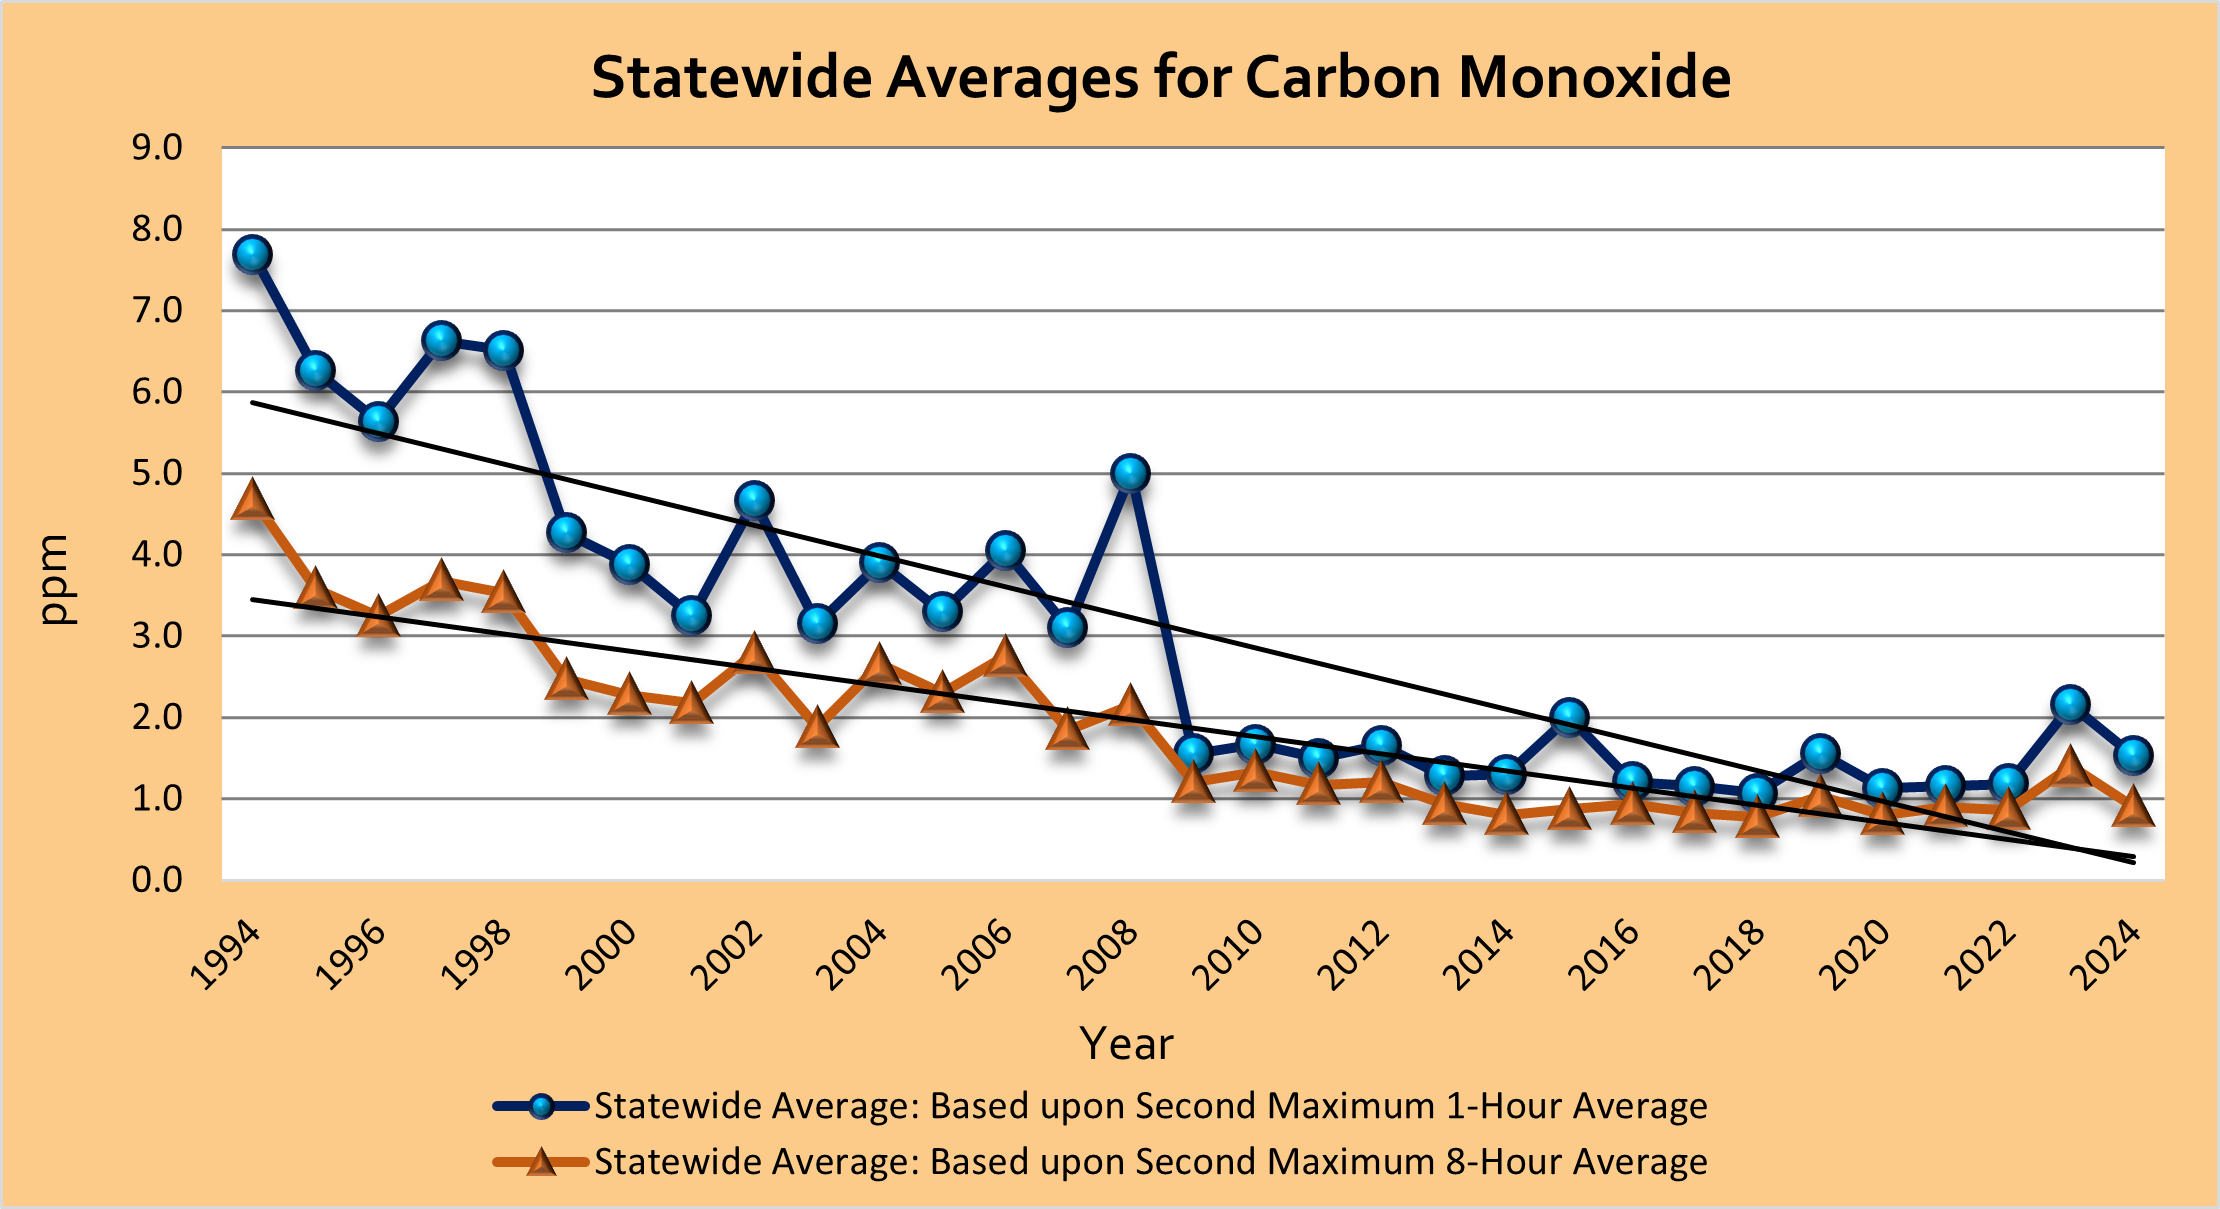
Statewide averages of carbon monoxide monitoring data show a steady decline over the past 20 years.